
Published on November 16th, 2018
A blog post by GMTaC Affiliate Graduate Student Alan Zhang.
A tremendous amount of human activity plays out in space. Commercial, military, and non-governmental organizations operate projects across various orbits around our planet. However, as space is out of view for most people, the public imagination of space missions and objects may differ surprisingly from what’s actually out there. More than 21,000 objects are in constant motion above us: scientific probes, military vehicles, governmental stations, and the multitude of satellites that enable GPS, TV, internet and phone service, and remote sensing services. Not to mention the junk and debris. I recently attended Analytical Graphics, Inc. (AGI)’s Space and Defense Software Expo, and was spellbound by the intricate, data-derived images on display. The showcase was visually striking, precise, and provocative.
The software product AGI is perhaps best known for – Systems Tool Kit (STK) – enables users to generate graphically-enhanced modeling environments and simulate precision operations. It “sets the standard for modeling and analyzing systems in a four-dimensional, interactive globe.” On exhibit at the expo, STK v11.5 boasts impressive functionality for those who, working with land, sea, air, and space systems, need to model, analyze, visualize and control objects with exacting precision. Space Situational Analysis or SSA, is essential to the planning and implementation of space projects.

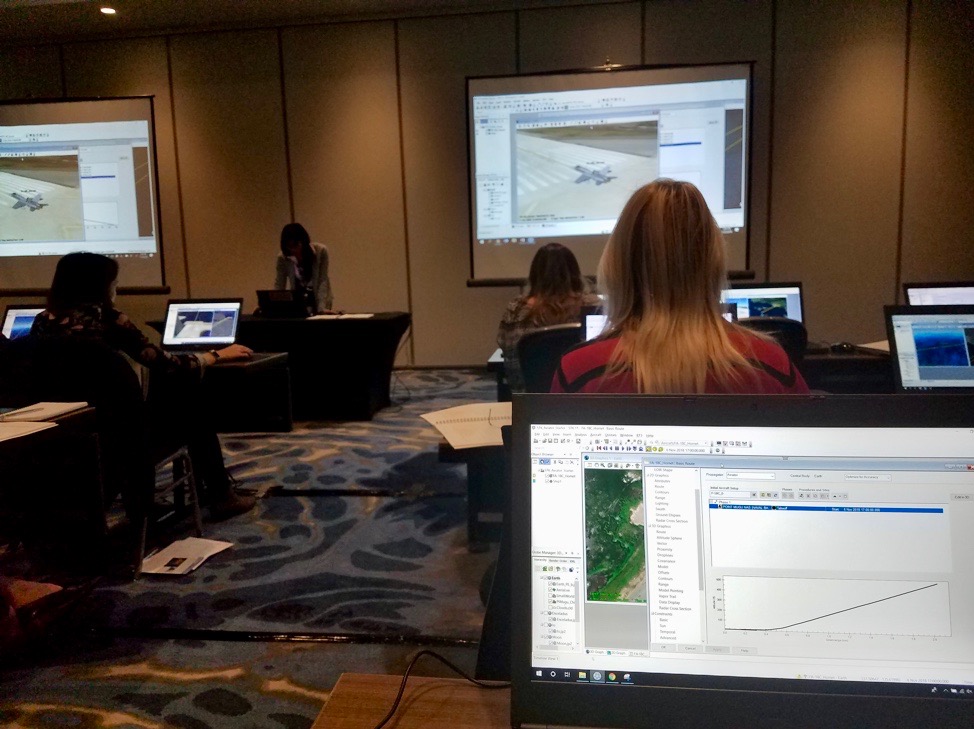
The volume of data, model parameters, and input sources involved in such work is immediately overwhelming without visual translation. What starts out as trillions of bytes of data feeding millions of computations and distributed over multiple clusters of cores ends up, for the STK user, presented in synthetic scenes, graphical interfaces, and intuitive drag-and-drop consoles. During the afternoon training workshop, even I, having no expertise in aerodynamics or systems engineering, was able to intercept hypersonic vehicles mid-flight and conduct maneuver and proximity operations with satellites in Geosynchronous Earth Orbit.
It is incredible just how complex space operations are. Seeing the clutter makes the challenges feel intractable. Once visualized, it becomes evident that the numerous and ever-growing mass of objects presents significant logistical challenges. Managing remote operations, which in the space economy is an imperative, relies crucially on long-distance satellite communications to grasp local conditions, coordinate positions, and trajectories. Radio frequency interference, broadcast jamming, and signal disruption all complicate the use of telemetry data.
The noise in space will only increase as more satellites find home in orbit. The FCC recently approved a SpaceX constellation project, StarLink, to add 11,925 new satellites into orbit. These communication satellites will join the 1,972 satellites in One Web’s constellation and the international space station, also in Low Earth Orbit. Thousands of more objects —satellites from other countries, defunct satellites, discarded rocket boosters, and piece of garbage—play in this elaborate choreography. AGI’s ComSpOC operations track these objects every second of every day from their Space Operation Center, leaning heavily on the visual nature of their software to make quick assessments and incident reports about approaching vehicles, potential collisions, and trajectory alterations. As more and more of earth’s media and communication infrastructure become linked to space assets, emerging vulnerabilities will need to be communicated to the public. After one day at the AGI Expo, I feel confident that visual affordances and graphical tools have perhaps the best opportunity to improve space literacy and access.